The importance of theory
Just as it happens in music, only a small number of people in the audio world have deep theoretical knowledge of what they are dealing with, because many people become involved as a hobby without professional intentions. Over my career at the mixing console, I've had the chance to work with all kinds of musicians. Some had more formal theoretical training than others, and I have always believed that, above all, talent is what really matters. However, it’s undeniable that when a talented musician acquires a certain level of theoretical knowledge, they become an unstoppable force of nature.
On one hand, they gain more fluency and speed (which leads to greater musical productivity), and on the other, it allows them to use a language with which they can convey complex ideas that would otherwise be impossible to explain. Sometimes musicians themselves are not even aware that, little by little, they are acquiring theoretical knowledge, because they run into it head‑on as they gain experience. For example, with one band I have worked with on several records since they barely started playing, I have seen over the years how they developed their own musical language that only they understand, and that describes many things you could find in music theory books. In my opinion, flamenco musicians are the clearest example of what I mean. We must keep in mind that music is an art, and as such, the best artist is not the one with the most technique and knowledge, but the one who shows the most “art” or expression.
In the world of audio, things are somewhat similar to music. Nobody really cares whether the person in charge of a recording has more or less theoretical training—only the result matters. But, even more than in music, those of us who live inside recording studios run into theoretical issues almost from the very first moment. Sooner or later, everyone reaches a point where they feel the need to acquire at least some basic knowledge in order to move forward. Unfortunately, in audio we are dealing with a physical/mathematical universe where vague concepts like “just a bit more” that are so common in music become too ambiguous.
I’ve always thought that theoretical knowledge is a factor that amplifies and enhances the knowledge gained through experience. Sometimes it is even the first step that lets us explore new paths which lead to new experiences, to the point where we later forget that we ever had to study those basic concepts because they became so ingrained. A few days ago, my three‑year‑old niece asked me: “Did you know that M and A together make MA?”. You are reading this text right now, so you can probably imagine what I’m talking about...
My idea is to write a series of introductory articles about sound and audio theory, which you will not necessarily have to read in order. If, at any point, understanding one of these articles requires having read another one, I will indicate it with a link. I hope to present more or less complex concepts in a clear and concise way so they can be understood by people without a strong background in physics or mathematics. My intention is purely educational, and if these articles help you take a first step toward a deeper exploration of any of the topics we touch—or simply serve as a short refresher—then I will have fulfilled more than my original goal.
We are going to start this series with what would be the equivalent of “M+A=MA” in the world of audio. Let’s look at some very basic concepts such as frequency, amplitude, and period.
Sinusoidal waves, graphs, and functions
You are probably used to seeing sinusoidal waves in books or on audio forums. And if you are into synthesizers, you probably dream about this kind of signal.
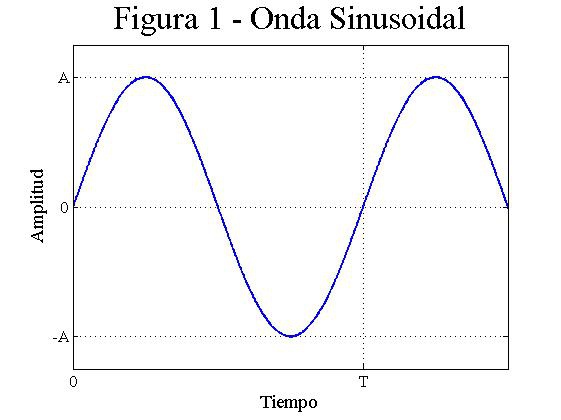
In Figure 1, you can see the graphical representation of a sinusoidal wave. In reality, it is just a two‑dimensional drawing of how the sine function changes for certain values of a variable (in our case, time). This may sound intimidating at first, but it is easier than it seems. Whenever you look at a graph, the first thing you should check is which phenomenon it represents. If you look closely at the graph above, on the Y‑axis we have amplitude, and on the X‑axis we have time. Therefore, it’s easy to see that we are looking at the variation of amplitude over a given time.
Usually, the units will be indicated; for example, in time we might find seconds, and for amplitude almost anything you can imagine (some type of decibels, sound pressure, voltage, electrical current, and so on). A graph like this is essentially what you see in any DAW (Pro Tools, Nuendo, Cubase, Samplitude, ...). You are more than used to seeing representations of this kind. In a DAW, since we are in a digital environment, the Y‑axis usually shows amplitude in dBFS, while the X‑axis shows time in whatever unit you choose, such as seconds or musical bars. For the moment, and since the details are irrelevant to our explanation, we will ignore that. We’ll simply say that there is amplitude and time.
The function above can be described by the following equation:

where A is the maximum amplitude, f is the frequency, and t is time.
With only this, we can already explain many of the basic concepts we work with in audio.
Cycle, period, and frequency
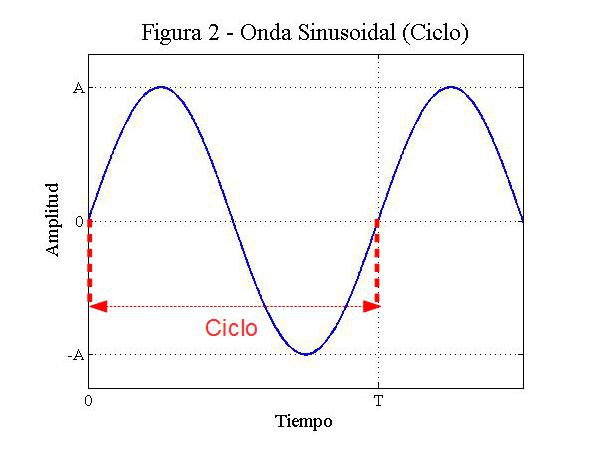
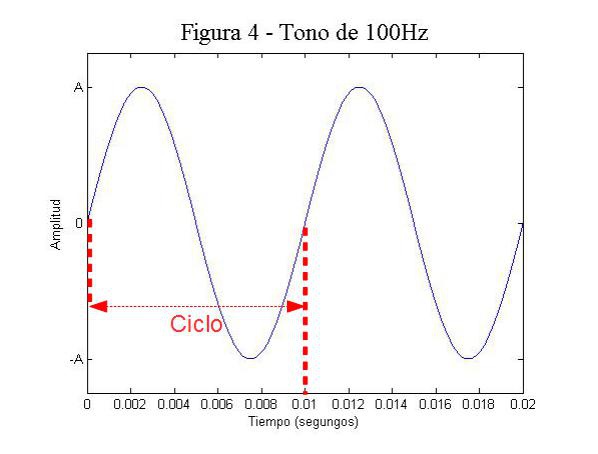
The first thing we need to be clear about is what cycle means. When we are dealing with signals that repeat over time, we can define a cycle as everything between the starting point of the waveform and the point where it returns to that same position under the same conditions. The last part is important: a cycle is not defined simply by reaching the same amplitude value, but by the moment when the drawn shape begins to repeat. For example, in the sinusoidal wave figure, if we choose the value amplitude = 0 as the starting point, we see that the amplitude also takes the value 0 right in the middle of the graph. A full cycle is completed only when the pattern of the waveform starts again. You can see this more clearly in Figure 3.
The period is the time it takes for one cycle to occur, and the frequency is the number of cycles that take place in one second. As you might imagine, period and frequency are related. The shorter the period, the more cycles occur in one second, and therefore the higher the frequency.
The mathematical relationship between frequency and period is as follows:

or, in other words:

In Figure 4, you can see an example of this. There we have a wave whose cycle takes 0.01 seconds to occur. Given what we’ve just said, its frequency will be:


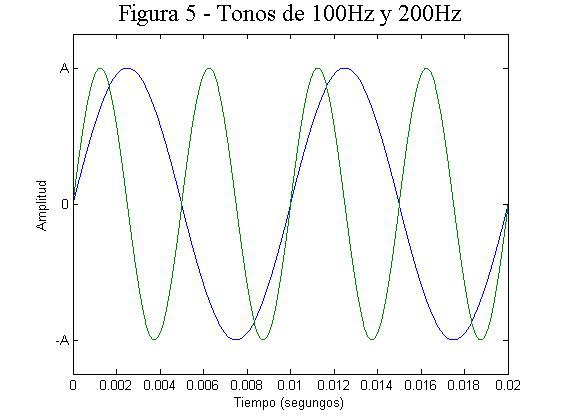
In Figure 5, we can clearly see the relationship between frequency and period. We see a 100 Hz tone (in blue) and a 200 Hz tone (in green). Over the time in which the 100 Hz tone completes one cycle, the 200 Hz tone completes two. Therefore, we confirm that when the frequency is higher, the time required for one cycle is shorter. The higher the frequency, the shorter the period.
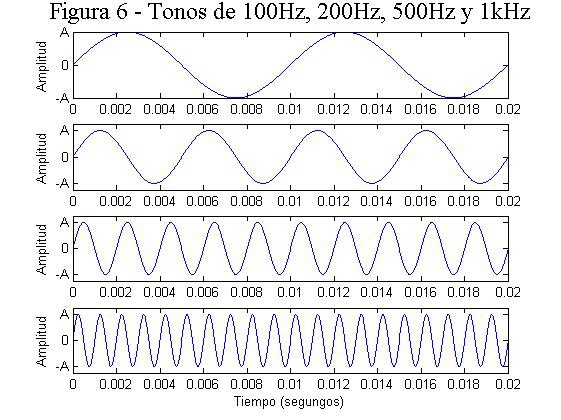
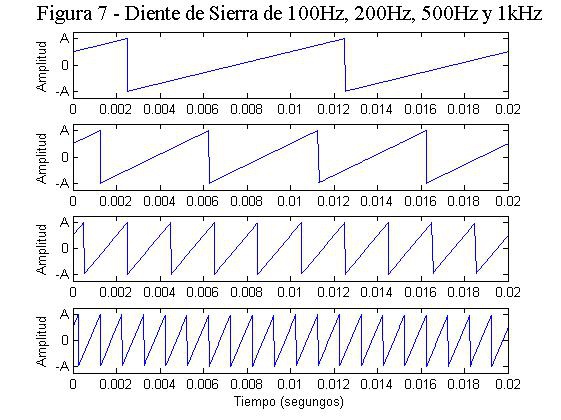
In Figures 6 and 7, I’ve plotted two types of signals (sine and sawtooth waves) and increased the frequency step by step so that you can easily see how the period decreases.
Amplitude
Let’s now focus on amplitude. As we’ve said, amplitude can represent many different things. In acoustics, it may represent SPL levels or acoustic power levels; in audio it can be dBFS in the digital world, dBu in analog systems, and so on. We’ll examine these in future articles when the time comes.
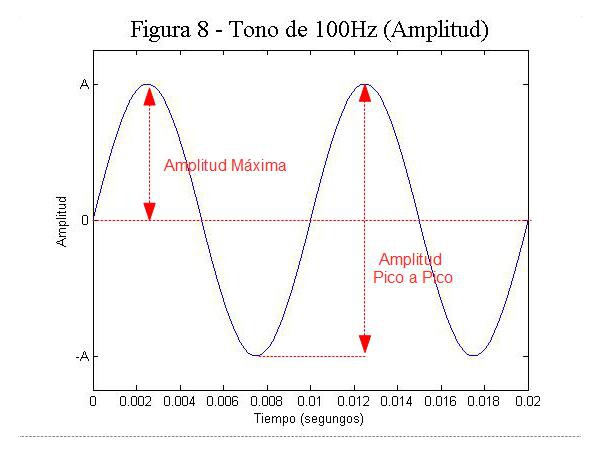
If we recall the equation that mathematically represents the sinusoidal wave we saw earlier, A is the maximum amplitude (or peak amplitude), and the peak‑to‑peak amplitude is the difference between the maximum and minimum values. In Figure 8, you can see a graphical representation of this.
Most of the time, we are going to be interested in the peak (maximum) amplitude and the effective amplitude or RMS value. While peak amplitude helps us avoid clipping, the RMS value is a good indicator of perceived loudness. I’m not going to go into details on how RMS amplitude is calculated, as it is fairly complex, and in practice we always have software tools that do this work for us.
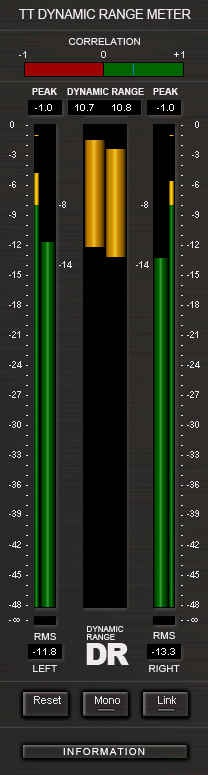
Free TT Dynamic Range Meter plugin by Pleasurize Music Foundation.
If we recall the equation that defined a sinusoidal signal, by now we have explained all the elements it contains:
However, there are two important issues to add: the initial phase and the initial amplitude. Let’s include these two factors in the equation:

The initial amplitude is what, in the audio world, we call a DC component (or DC offset in English), which we must avoid at all costs. It is normally removed by means of a high‑pass filter.
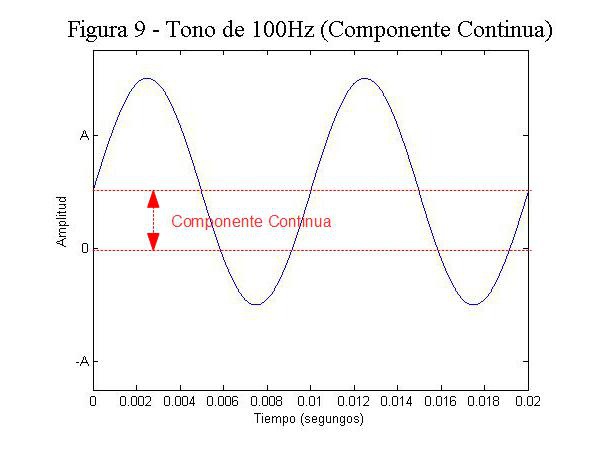
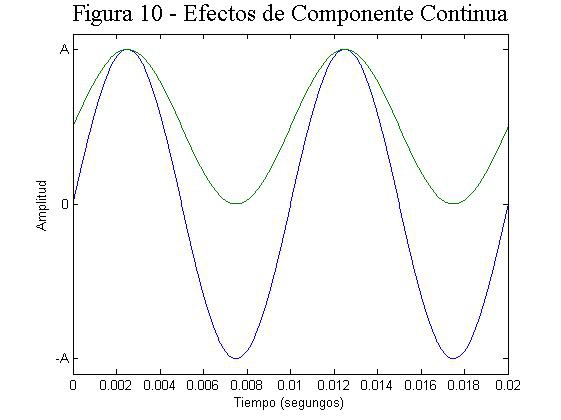
In Figure 9, we can see that, when a DC component exists in the signal, the whole waveform is shifted (in this case upwards, because the component has a positive value). Let’s look at the problem this causes with an example, represented in Figure 10.
Imagine we have a sinusoidal signal in a system where anything above amplitude A will clip. First we take a signal with no DC component (blue) and adjust its amplitude so that its peak reaches A, the point at which our system clips. Then we take another signal whose DC component has a value of A/2 (green) and do the same: we adjust its amplitude so that its peak also reaches A. We see that the blue signal has a much larger peak‑to‑peak amplitude than the green one, even though both of their peaks reach the same maximum amplitude A. Therefore, we see that a signal with a DC component will show a reduced RMS value, since even if we have a high peak level, the peak‑to‑peak value will be smaller than in a signal without DC offset.
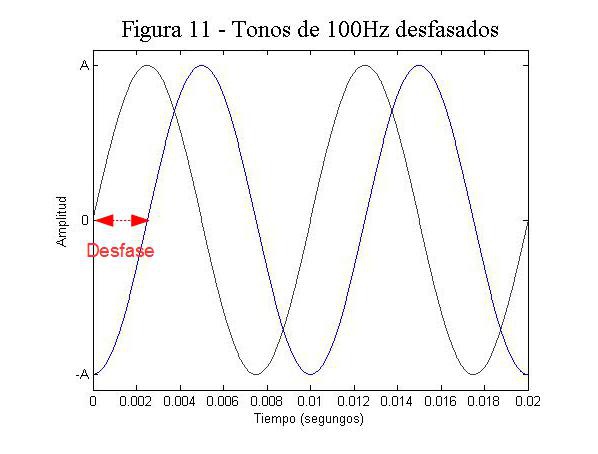
While the initial amplitude refers to a shift of the signal in terms of amplitude, the initial phase refers to a shift of the signal in time. This phase offset is usually expressed in degrees, although in audio it is very common to speak of phase shifts in seconds or milliseconds.
As we’ve said, phase shifts can also be expressed in degrees. This is because frequency can be expressed as an angular frequency. I won’t delve into this for now, although I will surely return to it in future articles. Nor will I provide a deeper analysis of phase here, since Hispasonic already hosts two very complete articles on this phenomenon written by Pablo Fernández‑Cid. You can find them here:
Phase: The Hidden Side of Audio.
Phase: The Hidden Side of Audio (II).
If you’ve made it this far, congratulations! I hope you fully absorb these concepts which, although they may seem boring at first, are necessary if you want to understand more interesting topics in the future. I also hope you’ll get hooked and join me in those upcoming articles.
Author: José A. Medina (2013)